Customize Consent Preferences

We use cookies to help you navigate efficiently and perform certain functions. You will find detailed information about all cookies under each consent category below.

The cookies that are categorized as "Necessary" are stored on your browser as they are essential for enabling the basic functionalities of the site. ... 

Always Active

Necessary cookies are required to enable the basic features of this site, such as providing secure log-in or adjusting your consent preferences. These cookies do not store any personally identifiable data.

No cookies to display.

Functional cookies help perform certain functionalities like sharing the content of the website on social media platforms, collecting feedback, and other third-party features.

No cookies to display.

Analytical cookies are used to understand how visitors interact with the website. These cookies help provide information on metrics such as the number of visitors, bounce rate, traffic source, etc.

No cookies to display.

Performance cookies are used to understand and analyze the key performance indexes of the website which helps in delivering a better user experience for the visitors.

No cookies to display.

Advertisement cookies are used to provide visitors with customized advertisements based on the pages you visited previously and to analyze the effectiveness of the ad campaigns.

No cookies to display.

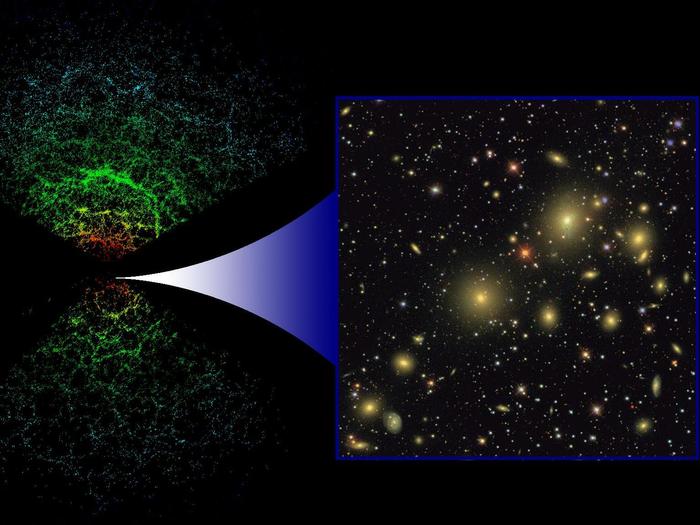
This illustration depicts the large-scale distribution of galaxies as seen by the Sloan Digital Sky Survey, an ambitious project that determined the distances of about one million galaxies.

The two cones on the left of the image are a three dimensional (3D) map of the galaxies with the Earth at the centre. Going from the centre to the upper/lower edges of the map, more and more distant galaxies are seen, up to distances of about 2 thousand million light years. The colour of the galaxies is related to their luminosity. The clumpiness in the distribution of matter is clearly visible in this representation.

The panel on the right shows a two dimensional (2D) image of galaxies in a small region of the sky. The 3D map is computed by combining the information contained in 2D images such as this one with an estimate of the distances of each individual object visible in it, derived from their spectra.

Suchen
Die neue Redshift-Generation

Solar Eclipse by Redshift

Sonnenfinsternis by Redshift für iOS

Die Sonnenfinsternis am 21. August 2017 beobachten, verstehen und bestaunen! » mehr

Solar Eclipse by Redshift

Sonnenfinsternis by Redshift für Android

Die Sonnenfinsternis am 21. August 2017 beobachten, verstehen und bestaunen! » mehr