Cassini Sees

Saturn on a Cosmic Dimmer Switch
Like a cosmic lightbulb on a dimmer switch, Saturn emitted gradually less energy each year from 2005 to 2009, according to observations by NASA's Cassini spacecraft. But unlike an ordinary bulb, Saturn's southern hemisphere consistently emitted more energy than its northern one. On top of that, energy levels changed with the seasons and differed from the last time a spacecraft visited Saturn in the early 1980s.
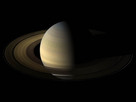
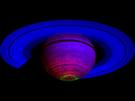
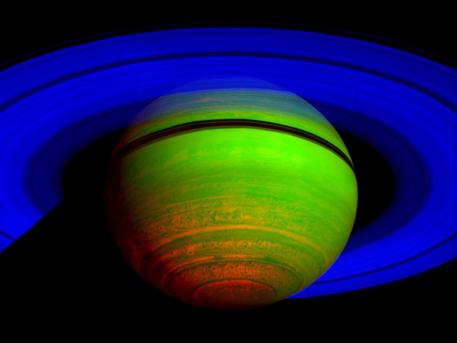
This false-color composite image, constructed from data obtained by NASA's Cassini spacecraft, shows Saturn's rings and southern hemisphere. The composite image was made from 65 individual observations by Cassini's visual and infrared mapping spectrometer in the near-infrared portion of the light spectrum on Nov. 1, 2008. The observations were each six minutes long.

This false-color composite image, constructed from data obtained by NASA's Cassini spacecraft, shows Saturn's rings and southern hemisphere. The composite image was made from 65 individual observations by Cassini's visual and infrared mapping spectrometer in the near-infrared portion of the light spectrum on Nov. 1, 2008. The observations were each six minutes long.

These never-before-seen trends came from a detailed analysis of long-term data from the composite infrared spectrometer (CIRS), an instrument built by NASA's Goddard Space Flight Center in Greenbelt, Md., as well as a comparison with earlier data from NASA's Voyager spacecraft. When combined with information about the energy coming to Saturn from the sun, the results could help scientists understand the nature of Saturn's internal heat source.

"The fact that Saturn actually emits more than twice the energy it absorbs from the sun has been a puzzle for many decades now," said Kevin Baines, a Cassini team scientist at NASA's Jet Propulsion Laboratory, Pasadena, Calif., and a co-author on a new paper about Saturn's energy output. "What generates that extra energy? This paper represents the first step in that analysis."

The research, reported this week in the Journal of Geophysical Research-Planets, was led by Liming Li of Cornell University in Ithaca, N.Y. (now at the University of Houston).

"The Cassini CIRS data are very valuable because they give us a nearly complete picture of Saturn," Li said. "This is the only single data set that provides so much information about this planet, and it's the first time that anybody has been able to study the power emitted by one of the giant planets in such detail."

The planets in our solar system lose energy in the form of heat radiation in wavelengths that are invisible to the human eye. The CIRS instrument picks up wavelengths in the thermal infrared region, far enough beyond red light where the wavelengths correspond to heat emission.

"In planetary science, we tend to think of planets as losing power evenly in all directions and at a steady rate," Li said. "Now we know Saturn is not doing that." (Power is the amount of energy emitted per unit of time.)

Instead, Saturn's flow of outgoing energy was lopsided, with its southern hemisphere giving off about one-sixth more energy than the northern one, Li explains. This effect matched Saturn's seasons: during those five Earth-years, it was summer in the southern hemisphere and winter in the northern one. (A season on Saturn lasts about seven Earth-years.) Like Earth, Saturn has these seasons because the planet is tilted on its axis, so one hemisphere receives more energy from the sun and experiences summer, while the other receives less energy and is shrouded in winter. Saturn's equinox, when the sun was directly over the equator, occurred in August 2009.

In the study, Saturn's seasons looked Earth-like in another way: in each hemisphere, its effective temperature, which characterizes its thermal emission to space, started to warm up or cool down as a change of season approached. The effective temperature provides a simple way to track the response of Saturn's atmosphere to the seasonal changes, which is complicated because Saturn's weather is variable and the atmosphere tends to retain heat. Cassini's observations revealed that the effective temperature in the northern hemisphere gradually dropped from 2005 to 2008 and started to warm up again by 2009. In the southern hemisphere, the effective temperature cooled from 2005 to 2009.

The emitted energy for each hemisphere rose and fell along with the effective temperature. Even so, during this five-year period, the planet as a whole seemed to be slowly cooling down and emitting less energy.

To find out if similar changes were happening one Saturn-year ago, the researchers looked at data collected by the Voyager spacecraft in 1980 and 1981 and did not see the imbalance between the southern and northern hemispheres. Instead, the two regions were much more consistent with each other.

Why wouldn't Voyager have seen the same summer-versus-winter difference between the two hemispheres? One explanation is that cloud patterns at depth could have fluctuated, blocking and scattering infrared light differently.

"It's reasonable to think that the changes in Saturn's emitted power are related to cloud cover," says Amy Simon-Miller, who heads the Planetary Systems Laboratory at Goddard and is a co-author on the paper. "As the amount of cloud cover changes, the amount of radiation escaping into space also changes. This might vary during a single season and from one Saturn-year to another. But to fully understand what is happening on Saturn, we will need the other half of the picture: the amount of power being absorbed by the planet."

Scientists will be doing that as a next step by comparing the instrument's findings to data obtained by Cassini's imaging cameras and infrared mapping spectrometer instrument. The spectrometer, in particular, measures the amount of sunlight reflected by Saturn. Because scientists know the total amount of solar energy delivered to Saturn, they can derive the amount of sunlight absorbed by the planet and discern how much heat the planet itself is emitting. These calculations help scientists tackle what the actual source of that warming might be and whether it changes.

Better understanding Saturn's internal heat flow "will significantly deepen our understanding of the weather, internal structure and evolution of Saturn and the other giant planets," Li said.

Source: NASA
Cassini Sees - Saturn on a Cosmic Dimmer Switch | Redshift live

Cassini Sees

Saturn on a Cosmic Dimmer Switch

Like a cosmic lightbulb on a dimmer switch, Saturn emitted gradually less energy each year from 2005 to 2009, according to observations by NASA's Cassini spacecraft. But unlike an ordinary bulb, Saturn's southern hemisphere consistently emitted more energy than its northern one. On top of that, energy levels changed with the seasons and differed from the last time a spacecraft visited Saturn in the early 1980s.
This false-color composite image, constructed from data obtained by NASA's Cassini spacecraft, shows Saturn's rings and southern hemisphere. The composite image was made from 65 individual observations by Cassini's visual and infrared mapping spectrometer in the near-infrared portion of the light spectrum on Nov. 1, 2008. The observations were each six minutes long.

This false-color composite image, constructed from data obtained by NASA's Cassini spacecraft, shows Saturn's rings and southern hemisphere. The composite image was made from 65 individual observations by Cassini's visual and infrared mapping spectrometer in the near-infrared portion of the light spectrum on Nov. 1, 2008. The observations were each six minutes long.

These never-before-seen trends came from a detailed analysis of long-term data from the composite infrared spectrometer (CIRS), an instrument built by NASA's Goddard Space Flight Center in Greenbelt, Md., as well as a comparison with earlier data from NASA's Voyager spacecraft. When combined with information about the energy coming to Saturn from the sun, the results could help scientists understand the nature of Saturn's internal heat source.

"The fact that Saturn actually emits more than twice the energy it absorbs from the sun has been a puzzle for many decades now," said Kevin Baines, a Cassini team scientist at NASA's Jet Propulsion Laboratory, Pasadena, Calif., and a co-author on a new paper about Saturn's energy output. "What generates that extra energy? This paper represents the first step in that analysis."

The research, reported this week in the Journal of Geophysical Research-Planets, was led by Liming Li of Cornell University in Ithaca, N.Y. (now at the University of Houston).

"The Cassini CIRS data are very valuable because they give us a nearly complete picture of Saturn," Li said. "This is the only single data set that provides so much information about this planet, and it's the first time that anybody has been able to study the power emitted by one of the giant planets in such detail."

The planets in our solar system lose energy in the form of heat radiation in wavelengths that are invisible to the human eye. The CIRS instrument picks up wavelengths in the thermal infrared region, far enough beyond red light where the wavelengths correspond to heat emission.

"In planetary science, we tend to think of planets as losing power evenly in all directions and at a steady rate," Li said. "Now we know Saturn is not doing that." (Power is the amount of energy emitted per unit of time.)

Instead, Saturn's flow of outgoing energy was lopsided, with its southern hemisphere giving off about one-sixth more energy than the northern one, Li explains. This effect matched Saturn's seasons: during those five Earth-years, it was summer in the southern hemisphere and winter in the northern one. (A season on Saturn lasts about seven Earth-years.) Like Earth, Saturn has these seasons because the planet is tilted on its axis, so one hemisphere receives more energy from the sun and experiences summer, while the other receives less energy and is shrouded in winter. Saturn's equinox, when the sun was directly over the equator, occurred in August 2009.

In the study, Saturn's seasons looked Earth-like in another way: in each hemisphere, its effective temperature, which characterizes its thermal emission to space, started to warm up or cool down as a change of season approached. The effective temperature provides a simple way to track the response of Saturn's atmosphere to the seasonal changes, which is complicated because Saturn's weather is variable and the atmosphere tends to retain heat. Cassini's observations revealed that the effective temperature in the northern hemisphere gradually dropped from 2005 to 2008 and started to warm up again by 2009. In the southern hemisphere, the effective temperature cooled from 2005 to 2009.

The emitted energy for each hemisphere rose and fell along with the effective temperature. Even so, during this five-year period, the planet as a whole seemed to be slowly cooling down and emitting less energy.

To find out if similar changes were happening one Saturn-year ago, the researchers looked at data collected by the Voyager spacecraft in 1980 and 1981 and did not see the imbalance between the southern and northern hemispheres. Instead, the two regions were much more consistent with each other.

Why wouldn't Voyager have seen the same summer-versus-winter difference between the two hemispheres? One explanation is that cloud patterns at depth could have fluctuated, blocking and scattering infrared light differently.

"It's reasonable to think that the changes in Saturn's emitted power are related to cloud cover," says Amy Simon-Miller, who heads the Planetary Systems Laboratory at Goddard and is a co-author on the paper. "As the amount of cloud cover changes, the amount of radiation escaping into space also changes. This might vary during a single season and from one Saturn-year to another. But to fully understand what is happening on Saturn, we will need the other half of the picture: the amount of power being absorbed by the planet."

Scientists will be doing that as a next step by comparing the instrument's findings to data obtained by Cassini's imaging cameras and infrared mapping spectrometer instrument. The spectrometer, in particular, measures the amount of sunlight reflected by Saturn. Because scientists know the total amount of solar energy delivered to Saturn, they can derive the amount of sunlight absorbed by the planet and discern how much heat the planet itself is emitting. These calculations help scientists tackle what the actual source of that warming might be and whether it changes.

Better understanding Saturn's internal heat flow "will significantly deepen our understanding of the weather, internal structure and evolution of Saturn and the other giant planets," Li said.

Source: NASA
» print article
Related articles:
Of the countless equinoxes Saturn has seen since the birth of the solar system, this one, captured here in a mosaic of light and dark, is the first witnessed up close by an emissary from Earth.
Revealing Saturn's Secrets

Cassini Reveals New Ring Quirks

» go to article
This unprocessed image was captured by NASA's Cassini spacecraft during its Nov. 21, 2009 flyby of Saturn's moon Enceladus. It shows the moon's south polar region, where jets of water vapor and other particles spew from fissures on the surface.
Enceladus' Mighty Plume

Cassini Sends Back Images of Enceladus as Winter Nears

» go to article
An aurora, shining high above the northern part of Saturn, moves from the night side to the day side of the planet in this movie recorded by Cassini.
Space Weather

Cassini Captures Ghostly Dance of Saturn's Northern Lights

» go to article
In this unique mosaic image combining high-resolution data from the imaging science subsystem and composite infrared spectrometer aboard NASA's Cassini spacecraft, pockets of heat appear along one of the mysterious fractures in the south polar region of Saturn's moon Enceladus.
Hotspots at Enceladus

Cassini Finds Plethora of Plumes

» go to article
This natural color view from the Cassini spacecraft highlights the myriad gradations in the transparency of Saturn's inner rings.
Strange Weather On Saturn

Cassini Shows Saturnian Roller Derby

» go to article
NASA's Cassini spacecraft captured the first lightning flashes on Saturn when it captured these images.
The Saturnian System

Cassini Sees Lightning on Saturn

» go to article
Amateur astronomer Christopher Go took this image of the storm on March 13, 2010. The arrow indicates the location of the storm and the red outlines show where Cassini's composite infrared spectrometer gathered data.
Planetary System

Cassini and Amateurs Chase Storm on Saturn

» go to article
On the left, Saturn's moon Enceladus is backlit by the sun, showing the fountain-like sources of the fine spray of material that towers over the south polar region. On the right, is a composite image of Titan.
Enceladus and Titan

Cassini Double Play

» go to article
This mosaic of images from NASA's Cassini spacecraft shows three fan-like structures in Saturn's tenuous F ring. Such "fans" suggest the existence of additional objects in the F ring.
NASA´s Spacecraft

Cassini Sees Moon Building Giant Snowballs in Saturn Ring

» go to article
This false-color composite image, constructed from data obtained by NASA's Cassini spacecraft, shows the glow of auroras streaking out about 1,000 kilometers (600 miles) from the cloud tops of Saturn's south polar region. It is among the first images released from a study that identifies images showing auroral emissions out of the entire catalogue of images taken by Cassini's visual and infrared mapping spectrometer.
Glowing southern lights on Saturn

New Views of Saturn's Aurora

» go to article
This artist's conception shows a nearly invisible ring around Saturn -- the largest of the giant planet's many rings. It was discovered by NASA's Spitzer Space Telescope.
New Saturn Ring Found

Space Telescope Discovers Largest Ring Around Saturn

» go to article
The individual photos making up the picture were taken by the Cassini space probe on January 19, 2007. In order also to capture the dark part of the rings, exposure times were used which mean that Saturn itself is overexposed and therefore shows as white. A section of the ring system lies in Saturn’s shadow.
Saturn's Ring System

How did Saturn get its rings?

» go to article
Since Saturn's axis is tilted as it orbits the sun, Saturn has seasons, like those of planet Earth -- but each of Saturn's seasons last for over seven years. The Hubble Space Telescope took the above sequence of images about a year apart. Starting on the left in 1996 and ending on the right in 2000.
Saturn's disappearance act

Saturn to Pull Celestial Houdini Today

» go to article
This mosaic combines 6 images--2 each of red, green and blue spectral filters--to create this natural color view. The images were obtained with the Cassini spacecraft wide-angle camera at a distance of approximately 750,000 miles from Saturn.
Fascinating picture of Saturn

Fun facts about Saturn

» go to article
This sequence of three images, obtained over the course of about 10 minutes, shows the path of a newly found moonlet in a bright arc of Saturn's faint G ring. Note that this streak is aligned with the G ring and moves along the ring.
Source of outer ring found

Newfound moon source of Saturn ring

» go to article
Search
Astronomy Software

Solar Eclipse by Redshift

Solar Eclipse by Redshift for iOS

Observe, understand, and marvel at the solar eclipse on August 21, 2017! » more

Solar Eclipse by Redshift

Solar Eclipse by Redshift for Android

Observe, understand, and marvel at the solar eclipse on August 21, 2017! » more

Cassini Sees

Saturn on a Cosmic Dimmer Switch

Like a cosmic lightbulb on a dimmer switch, Saturn emitted gradually less energy each year from 2005 to 2009, according to observations by NASA's Cassini spacecraft. But unlike an ordinary bulb, Saturn's southern hemisphere consistently emitted more energy than its northern one. On top of that, energy levels changed with the seasons and differed from the last time a spacecraft visited Saturn in the early 1980s.
This false-color composite image, constructed from data obtained by NASA's Cassini spacecraft, shows Saturn's rings and southern hemisphere. The composite image was made from 65 individual observations by Cassini's visual and infrared mapping spectrometer in the near-infrared portion of the light spectrum on Nov. 1, 2008. The observations were each six minutes long.

This false-color composite image, constructed from data obtained by NASA's Cassini spacecraft, shows Saturn's rings and southern hemisphere. The composite image was made from 65 individual observations by Cassini's visual and infrared mapping spectrometer in the near-infrared portion of the light spectrum on Nov. 1, 2008. The observations were each six minutes long.

These never-before-seen trends came from a detailed analysis of long-term data from the composite infrared spectrometer (CIRS), an instrument built by NASA's Goddard Space Flight Center in Greenbelt, Md., as well as a comparison with earlier data from NASA's Voyager spacecraft. When combined with information about the energy coming to Saturn from the sun, the results could help scientists understand the nature of Saturn's internal heat source.

"The fact that Saturn actually emits more than twice the energy it absorbs from the sun has been a puzzle for many decades now," said Kevin Baines, a Cassini team scientist at NASA's Jet Propulsion Laboratory, Pasadena, Calif., and a co-author on a new paper about Saturn's energy output. "What generates that extra energy? This paper represents the first step in that analysis."

The research, reported this week in the Journal of Geophysical Research-Planets, was led by Liming Li of Cornell University in Ithaca, N.Y. (now at the University of Houston).

"The Cassini CIRS data are very valuable because they give us a nearly complete picture of Saturn," Li said. "This is the only single data set that provides so much information about this planet, and it's the first time that anybody has been able to study the power emitted by one of the giant planets in such detail."

The planets in our solar system lose energy in the form of heat radiation in wavelengths that are invisible to the human eye. The CIRS instrument picks up wavelengths in the thermal infrared region, far enough beyond red light where the wavelengths correspond to heat emission.

"In planetary science, we tend to think of planets as losing power evenly in all directions and at a steady rate," Li said. "Now we know Saturn is not doing that." (Power is the amount of energy emitted per unit of time.)

Instead, Saturn's flow of outgoing energy was lopsided, with its southern hemisphere giving off about one-sixth more energy than the northern one, Li explains. This effect matched Saturn's seasons: during those five Earth-years, it was summer in the southern hemisphere and winter in the northern one. (A season on Saturn lasts about seven Earth-years.) Like Earth, Saturn has these seasons because the planet is tilted on its axis, so one hemisphere receives more energy from the sun and experiences summer, while the other receives less energy and is shrouded in winter. Saturn's equinox, when the sun was directly over the equator, occurred in August 2009.

In the study, Saturn's seasons looked Earth-like in another way: in each hemisphere, its effective temperature, which characterizes its thermal emission to space, started to warm up or cool down as a change of season approached. The effective temperature provides a simple way to track the response of Saturn's atmosphere to the seasonal changes, which is complicated because Saturn's weather is variable and the atmosphere tends to retain heat. Cassini's observations revealed that the effective temperature in the northern hemisphere gradually dropped from 2005 to 2008 and started to warm up again by 2009. In the southern hemisphere, the effective temperature cooled from 2005 to 2009.

The emitted energy for each hemisphere rose and fell along with the effective temperature. Even so, during this five-year period, the planet as a whole seemed to be slowly cooling down and emitting less energy.

To find out if similar changes were happening one Saturn-year ago, the researchers looked at data collected by the Voyager spacecraft in 1980 and 1981 and did not see the imbalance between the southern and northern hemispheres. Instead, the two regions were much more consistent with each other.

Why wouldn't Voyager have seen the same summer-versus-winter difference between the two hemispheres? One explanation is that cloud patterns at depth could have fluctuated, blocking and scattering infrared light differently.

"It's reasonable to think that the changes in Saturn's emitted power are related to cloud cover," says Amy Simon-Miller, who heads the Planetary Systems Laboratory at Goddard and is a co-author on the paper. "As the amount of cloud cover changes, the amount of radiation escaping into space also changes. This might vary during a single season and from one Saturn-year to another. But to fully understand what is happening on Saturn, we will need the other half of the picture: the amount of power being absorbed by the planet."

Scientists will be doing that as a next step by comparing the instrument's findings to data obtained by Cassini's imaging cameras and infrared mapping spectrometer instrument. The spectrometer, in particular, measures the amount of sunlight reflected by Saturn. Because scientists know the total amount of solar energy delivered to Saturn, they can derive the amount of sunlight absorbed by the planet and discern how much heat the planet itself is emitting. These calculations help scientists tackle what the actual source of that warming might be and whether it changes.

Better understanding Saturn's internal heat flow "will significantly deepen our understanding of the weather, internal structure and evolution of Saturn and the other giant planets," Li said.

Source: NASA
» print article

Search
Astronomy Software

Solar Eclipse by Redshift

Solar Eclipse by Redshift for iOS

Observe, understand, and marvel at the solar eclipse on August 21, 2017! » more

Solar Eclipse by Redshift

Solar Eclipse by Redshift for Android

Observe, understand, and marvel at the solar eclipse on August 21, 2017! » more